Australian equity market

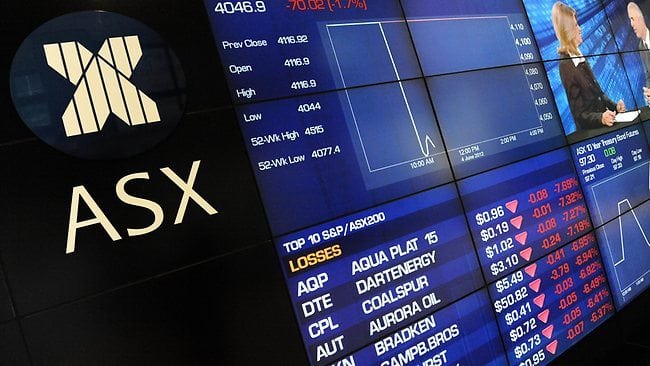
Local equities down but so are the others

The Australian equity market suffered its worst third quarter this year since the same quarter in 2011.

The All Ordinaries index dropped by 7.2% in the September quarter, taking its overall performance down 6.1% in the first nine months of 2015. Below-trend growth in the domestic economy or more worryingly, predictions of a recession — and its nasty consequences for corporate profits — has soured investor appetite for the local bourse.

“[The risk of recession] currently stands at the greatest probability since the global financial crisis”, the Sydney Morning Herald printed on 11 September quoting GS chief economist Tim Toohey.

This was quickly followed by Kima Capital’s warning that, “Australia is destined for a difficult recession at worst or a prolonged period of well-below-trend growth at best” again printed in the SMH less than three weeks later.

With such dire predictions, the Australian equity market’s negative return so far this year is hardly surprising.

However, the local bourse is caught in the same headwinds that are buffeting all other quity markets worldwide. THe All Ord’s minus 6.1% return is less than a percent lower than the negative 5.4% from developed market equities and better than the negative 9% return from emerging market equities over the same period.

To be sure, this would not prevent the Australian economy from succumbing to a recession but recent economic data and survey updates indicate it’s improving. — resilient, at worst — despite the on-going slow growth in the global economy and slowdown in emerging economies.

For instance, the latest NAB business survey shows confidence reviving to a plus 5 reading in September from plus 1 in the previous month. While the change in leadership from Abbott to Turnbull could have boosted confidence, remember that September was not a particularly good month due to heightened financial market volatility that culminated in the worst September quarter for equities since the third quarter of 2011.

This gives credence to NAB’s assessment that, “Overall, the business survey suggests a good degree of resilience in what appears to be a building non-mining sector recovery.” More so given the business conditions index remains elevated at a plus 9 reading, unchanged from August but up from the plus 6 reading in July.

Consumer confidence has also recovered. The Westpac/Melbourne Institute index of consumer sentiment rose by 4.2% to 97.8 in October from 93.9 in September. While still below 100 (optimists outnumber pessimists), the components of the index showed sharp improvements: Economic conditions expectations soared by 20% over the month, unemployment expectations dropped by 16.3% and expectations for family finances increased by 3.5%.

[via Financial Standard]

Interest Rates

Interest rates, the yield curve and investing

On the face of it yield curves tell us what interest rates are. They merely represent, after all, the term structure of yields at a given moment of time. But look behind the curtain and they tell a dramatic story of huge forces at work, all the while shaping the investment landscape in new and unusual ways.

With all the media focus on daily moves in sharemarkets or whether reserve banks are about to raise or lower cash rates it is easy to lose sight of the things that speak loudest and clearest. Understanding interest rates and the yield curve is crucial to creating logical and effective investment strategies, yet they remain one of the most misunderstood of investment concepts.

By taking snapshots of the Australian yield curve at different points in time over the past six years we illustrate the different investment environments we have been through and anticipate those to come.

Yield is the income earned for a given price. It is the same concept whether the asset is cash, a fixed coupon bond, equities or property. The yield is meant to compensate the investor for the risk of holding the asset. Therefore, the more risky the asset, the higher the yield should be. The yield curve is the line that plots the interest rates at a point in time of bonds having equal credit quality but different maturity dates. Normally, they are upwards sloping, with cash having the lowest yield and long dated bonds the highest. Cash returns the least because there is no risk of capital loss (although there is a risk of real capital loss, once inflation is taken into account) and it is the definition of liquidity.

Cash is also directly set by the central bank in the service of its economic objectives, such as price stability or economic growth. Longer dated bonds are more risky because their price is more volatile. They may pay a regular guaranteed coupon but the longer they have to go before maturity the more risk there is that things can go wrong. Interest rates generally might rise, meaning that the capital value of the bond will fall. The longer dated it is, the more it would fall. If interest rates fall, the price of the bond will rise. Investors want to be compensated for this uncertainty.

But yield curves in the real world are not all upwards sloping. They come in all shapes and sizes, and they tell a fascinating story. In this story we look at three Australian yield curves, three years apart and see what they tell us about the investment landscape at the time, and of the future.

The following chart shows an upwards sloping yield curve from September 2009. It signals that things are good economically and expectations for the future are high. The cash rate was 3%. The Reserve Bank had been cutting rates from a peak of 7.25% one year before. The stock market was in the midst of a bull run that had just seen it rise 46% int he previous seven months and still had a long way to go. The economy was robust and commodity prices were high. Oil was US$65 a barrel and iron ore was US$80 a metric tonne, up from US$38 five years previously, and the Australian dollar was on the rise, buying US$0.88 at the time.

Australian government bond yield curves

Fast forward three years to 2012 and the yield curve looks completely different. So does the world. In the intervening period the Reserve Bank has increased cash rates to as high as 4.75% in an effort to slow growth and then started reducing rates to 3.5%. The yield on a 15 year government bond has dropped more than two percentage points from 5.5% to 3.3% indicating growth for the future looks subdued. The yield curve is now inverted and negative. The fact that cash rate is higher than longer term government bonds is extremely worrying and clearly signals that the Reserve Bank will continue to cut short term interest rates.

Meanwhile the Australian Dollar has already reached its peak against the US Dollar of US$1.10 but is still worth US$1.04, 18% higher than three years previously. Crude oil has risen 70% in three years and is worth US$112 a barrel. Iron ore, meanwhile, is US$100 a tonne, down around one third in four short months but still massively higher than the long run average.

The Australian sharemarket had risen 10% in four months, and as interest rates are lowered, is about to go on a tear and add about 24% in the next 12 months.

Fast forward again to the end of September 2015. Economic prospects for the country are much more subdued, the sharemarket is down around 13% from its 2015 peak — nearly all of this in the previous two savage months. The cash rate is sitting at 2%, as it has done for five previous months, and doesn’t look like going anywhere except down for the foreseeable future. There doesn’t appear to be much risk of recession, but not a lot of economic growth in the medium future either. The iron ore price has collapsed to US$57 a metric tonne, but remains volatile. The Australian Dollar is now buying US$0.70. The yield curve has had a huge parallel shift down. It’s flat for five years and then slightly positive from 10 to 15 years. The one and three year rates are lower than cash, indicating that expectations for economic growth are very low.

[via Financial Standard]

Global Economy Stocks

Mandate tide turns towards global equities

Institutional investors are moving fast to protect their portfolios from the risks facing the Australian market. Over a third of the money poured into new mandates last year was in international equities, twice the amount of new funds invested in Australian equities.

The latest edition of the Rainmaker Research Mandate Chaser report shows that Australian institutional investors awarded about $29 billion in mandates during the year to June 2015. As much as 34% of these funds went into international equities mandates, while about 18% was invested in Australian equities. Alternatives, another rising trend, accounted for about 22% of new mandates.

This represents a sharp change compared to previous years. New institutional money invested in Australian equities has been consistently falling over the last few years, with the sharpest fall registered between June 2014 and June 2015.

“We are having a number of [institutional] clients reweighting away from Australian equities and into international equities,” Hyperion managing director Tim Samway said.

The Australian equities manager is close to reaching capacity and closed its institutional business to new inflows last April. At the same time, the Hyperion team is researching international stocks and managing an internal portfolio with the aim of building and launching a global equities product in the future.

The increase in international equities mandates is significant in the context an overall fall in the number of new mandates. Rainmaker Research shows that institutional investors awarded 287 new mandates in 2015, fewer than the 385 awarded in 2014 or the 664 in 2011.

“The mandates that we win have been stickier,” Samway explained. “We have a number of investors that have been with us for around 10 years or even more.” He added that this reflects superannuation funds’ increasing focus on long term objectives, but also awareness that appointing new managers can be costly.

“Super funds are getting a large exposure of their portfolios to passive strategies and they come to active managers and boutiques looking for alpha,” he said.

REST chief executive Damian Hill explained: “We don’t turn over managers that much and we try not to have too many managers. We don’t mind that much the size of the initial mandate, but the capacity to grow it in the future.”

Hill confirmed that the trend for in-housing could also be having an impact. “Of the latest four or five new mandates, two or three have been to our internal team,” he said. However, he highlighted that as the industry matures and more superannuation members move towards retirement, net flows are going to be lower. “This will make funds more circumspect about what they do. They will have to pay more attention to their cashflow as payments and superannuation benefits increase.”

UBS Asset Management is among the top 10 managers to receive more mandate inflows over the last three years. Head of Australia and New Zealand Bryce Doherty said that a reason behind the decrease in new mandates is that funds are bringing the management of traditional asset classes in-house and look elsewhere for more sophisticated strategies.

“Funds are moving away from the idea that they need to have large, broad portfolios.” Instead, they demand multi-asset strategies and solutions that can be tailored for the needs of each fund.

“They want good performance, but also risk management tools and economic insights from what is happening in other countries; information that they can’t get by themselves,” he said.

QIC executive director of strategy, clients and global markets, Brian Delaney, has experienced similar changes in demand. “More and more clients are looking for solutions that might not necessarily result in a product,” Delaney said.

This could also explain the decrease in the number of new mandates: “Going back, a manager would build a product and run the same thing for many clients. But now we are looking at strategies, engaging with clients about particular things they have to solve.

“The sophistication level of clients has increased and as a result they are getting quite particular about what they want to pay for,” Delaney said, adding: “In the past, some were paying active fees for beta driven asset classes. Now they are getting smarter about the questions they need to ask,” a trend that is forcing the rest of the industry to lift its game.

[via Financial Standard]

A$ down but will it stay down?

[vc_row][vc_column][vc_column_text]Here we go, here we go, here we go…

The Australian dollar is back in the news again for it has fallen below $0.73US late last month to $0.7278US — the lowest level since April 2009.

I can’t help but feel confused, because for all throughout the duration of the Greek tragic-comedy and the depression-inducing crash in China’s stockmarket, the AUD has remained not only above $0.74US but was fetching more than $0.76US.

Just when the Shanghai and Shenzhen exchanges stablise, China’s economy grows better than many expected and the Grexit was kicked three years further down the road, the AUD falls?

Not that there’s anything to complain about and the certainly RBA Governor Clenn Stevens would be pleased at this latest development. Gov Glenn would be happier with Black Rock’s prediction of a slide to around $0.70US before the New Year and Capitol Economics’ forecast of $0.65US by end-2016!

However, these are for reasons mostly recycled. Slowing China would take down commodity prices.

The rationale for the AUD’s fall is the divergence in monetary policy — with Greece and China now out of the way (or seemingly) — the Fed can now lift while RBA is expected to remain on hold, or, potentially cut further.

The AUD action — like we’ve seen over the past few months, is mainly a US dollar story, i.e, it depends on expectations of whether or not the Fed lifts, and when it does so.

Will it? Can it? Not if you ask the Federal Reserve Bank of New York.

Authors Mary Amiti and Tyler Bodine-Smith argue that “a 10% appreciation in one quarter shaves 0.5 percentage points off GDP growth over one year and an additional 0.2 percentage points in the following year if the strength of the dollar persists.”

Against major currencies, the US dollar has appreciated by 5.7% over the past three months and 21.3% over the past 12 months.

The bottom line is that the AUD’s fortune remains largely at the hands of the Fed and what it decides on interest rates.

— via the FINANCIAL STANDARD, Aug 11[/vc_column_text][/vc_column][/vc_row]