Posts

Education key in combating elderly financial abuse

Education key in combating elder financial abuse

Financial advice practices will be able to equip staff with greater knowledge and understanding around identifying and preventing elder financial abuse through a selection of new education and training materials.
Protecting Seniors Wealth has launched a range of resources including presentations, training courses, and publications to create awareness and assist in developing strategies to deal with senior and elder financial abuse efficiently.
The company believes financial planners are in a unique position to assist in protection seniors and their wealth as they assist in the management of their finances and so should incorporate this sort of training into their business plains, promoting trust and building on their business’ reputation.
“Seniors and elders are prime targets, they hold the largest share of wealth and often need assistance dealing with unwanted financial predictors, and the focus is on the seriousness of this issue – rapid increases, how seniors are impacted how much money and assets are being stolen.” Protecting Seniors Wealth chief executive Anne McGowan
“its motivational and provides opportunity to relate in terms of possible loss of their own clients and funds, providing strategic insight and knowledge for assisting to be money gatekeepers.”
McGowan believes the findings of the Australian law reform commission’s inquiry into Elder Abuse will indicate the need for more education, with the new resources working toward fulfilling the need.
“The disturbing consequences of this form of abuse are so profound that when financial perpetrators take senior elders money and assets, they often also take the funds they need for their lifestyle and age care, along with their dignity and the inheritance they plan to leave loved ones, resulting in the final insult – inheritance being stolen or taken as well,” McGowan said.
Resources from Protecting Seniors Wealth can also be tailored for CPD accreditation.
Separately, the Australian Tax Office (ATO) is reminding Australians to stop and think before giving their personal details or hard earned money to scammers this tax time.
Assistant Commissioner Kath Anderson said 48,084 scams were reported to the ATO between July and October last year.
“we have already seen a Five-fold increase during the tax time period,” Anderson said.
“Already this year, the ATO has registered over 17,067 scam reports. Of these, 113 Australians handed over $1.5 Million to fraudsters with about 2500 providing some form of personal information including tax file numbers.”

[via FINANCIAL STANDARD]

Super funds return 2.9%

Super funds return 2.9%

Superannuation funds have returned an average of 2.9% for the 12 months to 30th June as measured by the SelectingSuper workplace default option MySuper Index, propped up by property and fixed income.

The SelectingSuper workplace default option MySuper Index showed a negative 0.9% monthly return in June.

However, combined with the positive return in the period March to May, the rolling 12-month performance for the 2015-16 financial year was a positive 2.9%.

The monthly fall in superannuation performance in June was driven by a fall in both Australian and international equities. The negative return for super funds in the latest month comes at the end of a period of relatively volatile returns in the first six months of the 2016 calendar year.

The positive 2.9% performance for funds in the 2015-16 financial year, although lower than prior years, was nearly 2% above inflation for the period.

The performance over multi-year time periods benefits from the positive impact of high returns in the years 2013-15. Reflecting this, three-year rolling MySuper returns are 8.3%pa and five-year returns are 8.1%pa. The longer term 10-year return is a more modest 5.2%pa although this period incorporates the full effect of the GFC and is overlaid by a lower inflation environment.

On an annual basis, Australian equities, often the largest asset class in many balanced funds, positively contributed a 0.6% return as the market has progressively drifted down since early 2015. The contribution of international equities has been a positive 0.4%, although this impact has been muted by many funds through hedging inbuilt within their portfolios.

Property has continued to provide a significant positive impact on fund investment outcomes with the listed property sector having a positive 24.5% return in the 12-months to end June. To further highlight the positive impact buffering that property has had on superannuation returns, the three-year average return to June 2016 from listed property is 18.5%.

Over the year ended June 2016, the fixed interest index return was a strong 7%, although, on average, fixed income portfolios within superannuation funds underperformed this index. Meanwhile, cash returned a modest 2.3% over the same period.

In net terms, this means funds with relatively high exposure to Australian equities and international equities underperformed in the 12 months to end April. Similarly funds with relatively larger holdings in property and potentially fixed interest outperformed in the period.

Regarding the market segments, the gap between not-for-profit (NFP) funds and retail funds within the Workplace sector continues. The 12-month return gap is now 120 basis points in favour of NFP funds. The long-term five-year segment gap is 30 basis points in favour of NFP funds.

[via the Financial Standard]

Australian equity market

Local equities down but so are the others

The Australian equity market suffered its worst third quarter this year since the same quarter in 2011.

The All Ordinaries index dropped by 7.2% in the September quarter, taking its overall performance down 6.1% in the first nine months of 2015. Below-trend growth in the domestic economy or more worryingly, predictions of a recession — and its nasty consequences for corporate profits — has soured investor appetite for the local bourse.

“[The risk of recession] currently stands at the greatest probability since the global financial crisis”, the Sydney Morning Herald printed on 11 September quoting GS chief economist Tim Toohey.

This was quickly followed by Kima Capital’s warning that, “Australia is destined for a difficult recession at worst or a prolonged period of well-below-trend growth at best” again printed in the SMH less than three weeks later.

With such dire predictions, the Australian equity market’s negative return so far this year is hardly surprising.

However, the local bourse is caught in the same headwinds that are buffeting all other quity markets worldwide. THe All Ord’s minus 6.1% return is less than a percent lower than the negative 5.4% from developed market equities and better than the negative 9% return from emerging market equities over the same period.

To be sure, this would not prevent the Australian economy from succumbing to a recession but recent economic data and survey updates indicate it’s improving. — resilient, at worst — despite the on-going slow growth in the global economy and slowdown in emerging economies.

For instance, the latest NAB business survey shows confidence reviving to a plus 5 reading in September from plus 1 in the previous month. While the change in leadership from Abbott to Turnbull could have boosted confidence, remember that September was not a particularly good month due to heightened financial market volatility that culminated in the worst September quarter for equities since the third quarter of 2011.

This gives credence to NAB’s assessment that, “Overall, the business survey suggests a good degree of resilience in what appears to be a building non-mining sector recovery.” More so given the business conditions index remains elevated at a plus 9 reading, unchanged from August but up from the plus 6 reading in July.

Consumer confidence has also recovered. The Westpac/Melbourne Institute index of consumer sentiment rose by 4.2% to 97.8 in October from 93.9 in September. While still below 100 (optimists outnumber pessimists), the components of the index showed sharp improvements: Economic conditions expectations soared by 20% over the month, unemployment expectations dropped by 16.3% and expectations for family finances increased by 3.5%.

[via Financial Standard]

Interest Rates

Interest rates, the yield curve and investing

On the face of it yield curves tell us what interest rates are. They merely represent, after all, the term structure of yields at a given moment of time. But look behind the curtain and they tell a dramatic story of huge forces at work, all the while shaping the investment landscape in new and unusual ways.

With all the media focus on daily moves in sharemarkets or whether reserve banks are about to raise or lower cash rates it is easy to lose sight of the things that speak loudest and clearest. Understanding interest rates and the yield curve is crucial to creating logical and effective investment strategies, yet they remain one of the most misunderstood of investment concepts.

By taking snapshots of the Australian yield curve at different points in time over the past six years we illustrate the different investment environments we have been through and anticipate those to come.

Yield is the income earned for a given price. It is the same concept whether the asset is cash, a fixed coupon bond, equities or property. The yield is meant to compensate the investor for the risk of holding the asset. Therefore, the more risky the asset, the higher the yield should be. The yield curve is the line that plots the interest rates at a point in time of bonds having equal credit quality but different maturity dates. Normally, they are upwards sloping, with cash having the lowest yield and long dated bonds the highest. Cash returns the least because there is no risk of capital loss (although there is a risk of real capital loss, once inflation is taken into account) and it is the definition of liquidity.

Cash is also directly set by the central bank in the service of its economic objectives, such as price stability or economic growth. Longer dated bonds are more risky because their price is more volatile. They may pay a regular guaranteed coupon but the longer they have to go before maturity the more risk there is that things can go wrong. Interest rates generally might rise, meaning that the capital value of the bond will fall. The longer dated it is, the more it would fall. If interest rates fall, the price of the bond will rise. Investors want to be compensated for this uncertainty.

But yield curves in the real world are not all upwards sloping. They come in all shapes and sizes, and they tell a fascinating story. In this story we look at three Australian yield curves, three years apart and see what they tell us about the investment landscape at the time, and of the future.

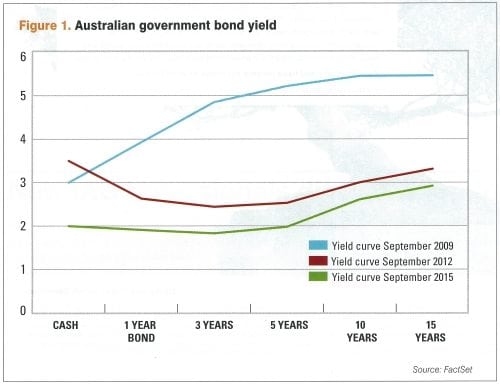
The following chart shows an upwards sloping yield curve from September 2009. It signals that things are good economically and expectations for the future are high. The cash rate was 3%. The Reserve Bank had been cutting rates from a peak of 7.25% one year before. The stock market was in the midst of a bull run that had just seen it rise 46% int he previous seven months and still had a long way to go. The economy was robust and commodity prices were high. Oil was US$65 a barrel and iron ore was US$80 a metric tonne, up from US$38 five years previously, and the Australian dollar was on the rise, buying US$0.88 at the time.

Australian government bond yield curves

Fast forward three years to 2012 and the yield curve looks completely different. So does the world. In the intervening period the Reserve Bank has increased cash rates to as high as 4.75% in an effort to slow growth and then started reducing rates to 3.5%. The yield on a 15 year government bond has dropped more than two percentage points from 5.5% to 3.3% indicating growth for the future looks subdued. The yield curve is now inverted and negative. The fact that cash rate is higher than longer term government bonds is extremely worrying and clearly signals that the Reserve Bank will continue to cut short term interest rates.

Meanwhile the Australian Dollar has already reached its peak against the US Dollar of US$1.10 but is still worth US$1.04, 18% higher than three years previously. Crude oil has risen 70% in three years and is worth US$112 a barrel. Iron ore, meanwhile, is US$100 a tonne, down around one third in four short months but still massively higher than the long run average.

The Australian sharemarket had risen 10% in four months, and as interest rates are lowered, is about to go on a tear and add about 24% in the next 12 months.

Fast forward again to the end of September 2015. Economic prospects for the country are much more subdued, the sharemarket is down around 13% from its 2015 peak — nearly all of this in the previous two savage months. The cash rate is sitting at 2%, as it has done for five previous months, and doesn’t look like going anywhere except down for the foreseeable future. There doesn’t appear to be much risk of recession, but not a lot of economic growth in the medium future either. The iron ore price has collapsed to US$57 a metric tonne, but remains volatile. The Australian Dollar is now buying US$0.70. The yield curve has had a huge parallel shift down. It’s flat for five years and then slightly positive from 10 to 15 years. The one and three year rates are lower than cash, indicating that expectations for economic growth are very low.

[via Financial Standard]