Exchange traded products

ETP demand grows, fees stable

Exchange traded products (ETP) are charging fees disproportionately to the dramatic growth in assets and number of products available, according to Rainmaker data.
Between March 2013 and 2017, ETP funds under management quadrupled from $ 7.2 billion to $ 27.2 billion, while the number of products in the market doubled from 79 to 155.
EPT products have gained sufficient size to counteract the effect of lower fees on the original product and kept the overall weighted Management Expense Ratio (MER) the same, the quarterly ETP report said.
It found BlackRock, Vanguard, State Street, BetaShares, Magellan, Van Eck, Russell and ANZ ETFs comprise 98% of the market and among them, charge a wide range of MER of 0.18% per annum, followed by State Street at 0.25%. Magellan’s weighted MER is six times that of Vanguard’s across three of its actively managed ETPs.
What the data ultimately shows is there “is no correlation between a manager’s ability to gather assets and fees being charged.”
“The largest asset gatherers ran the gamut of fees structures and product types. What this does show, however, is that the Australian EPT market is continuing to evolve into the product offering the associated fee structure,” it said.
In the 12 months to March, ETP FUM rose 28% to $27 billion, with a marked shift to international equities and fixed interest assets classes.
International equity ETPs were the most active during the period with 72 products launched, followed by Australian equities with 46, fixed interest with 17 and commodities with 11.

[via FINANCIAL STANDARD]

How super investment option fees vary

How super investment option fees vary

Superannuation members who have selected an investment option other than their fund’s balanced option may be paying more in fees than they realise, according to research by Rainmaker.

The Researcher said investment management fees generally account for around half of the total fees paid by members.

However this is based on the average member who remains in the default investment option (around 40%) there is a range of members who elect to choose their own option, and for these members, the investment management fees vary significantly.

A review of the option specific fees across 30,000 individual investment option within Rainmaker superannuation database shows fees varied significantly by asset sector and by type of fund. the analysis also shows the fees for selected options were significantly higher than the fees for the default investment options within workplace funds.

The average investment management fee for workplace super is currently at 0.62%. However, once you step out of the MySuper default options, the comparative investment fee increases meaningfully.

The average fee for a diversified option is 0.84%, over 20 bps above the fee for the workplace default option.

Growth diversified options carry a slightly higher average of 0.87%.

The price of diversified options for retail superannuation funds is on average around 25 bps above diversified options for not-for-profit superannuation funds.

The range of investment fees is wider in respect to asset specific options. While cash and fixed interest options are, on average, below 0.5%, the average fees for equity options are 1.1%. Above these, options for alternative and hedged assets average 1.2% and 1.9% respectively.

[via FINANCIAL STANDARD]

Interest Rates

Interest rates, the yield curve and investing

On the face of it yield curves tell us what interest rates are. They merely represent, after all, the term structure of yields at a given moment of time. But look behind the curtain and they tell a dramatic story of huge forces at work, all the while shaping the investment landscape in new and unusual ways.

With all the media focus on daily moves in sharemarkets or whether reserve banks are about to raise or lower cash rates it is easy to lose sight of the things that speak loudest and clearest. Understanding interest rates and the yield curve is crucial to creating logical and effective investment strategies, yet they remain one of the most misunderstood of investment concepts.

By taking snapshots of the Australian yield curve at different points in time over the past six years we illustrate the different investment environments we have been through and anticipate those to come.

Yield is the income earned for a given price. It is the same concept whether the asset is cash, a fixed coupon bond, equities or property. The yield is meant to compensate the investor for the risk of holding the asset. Therefore, the more risky the asset, the higher the yield should be. The yield curve is the line that plots the interest rates at a point in time of bonds having equal credit quality but different maturity dates. Normally, they are upwards sloping, with cash having the lowest yield and long dated bonds the highest. Cash returns the least because there is no risk of capital loss (although there is a risk of real capital loss, once inflation is taken into account) and it is the definition of liquidity.

Cash is also directly set by the central bank in the service of its economic objectives, such as price stability or economic growth. Longer dated bonds are more risky because their price is more volatile. They may pay a regular guaranteed coupon but the longer they have to go before maturity the more risk there is that things can go wrong. Interest rates generally might rise, meaning that the capital value of the bond will fall. The longer dated it is, the more it would fall. If interest rates fall, the price of the bond will rise. Investors want to be compensated for this uncertainty.

But yield curves in the real world are not all upwards sloping. They come in all shapes and sizes, and they tell a fascinating story. In this story we look at three Australian yield curves, three years apart and see what they tell us about the investment landscape at the time, and of the future.

The following chart shows an upwards sloping yield curve from September 2009. It signals that things are good economically and expectations for the future are high. The cash rate was 3%. The Reserve Bank had been cutting rates from a peak of 7.25% one year before. The stock market was in the midst of a bull run that had just seen it rise 46% int he previous seven months and still had a long way to go. The economy was robust and commodity prices were high. Oil was US$65 a barrel and iron ore was US$80 a metric tonne, up from US$38 five years previously, and the Australian dollar was on the rise, buying US$0.88 at the time.

Australian government bond yield curves

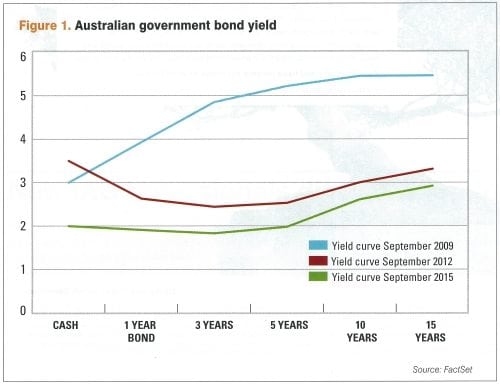
Fast forward three years to 2012 and the yield curve looks completely different. So does the world. In the intervening period the Reserve Bank has increased cash rates to as high as 4.75% in an effort to slow growth and then started reducing rates to 3.5%. The yield on a 15 year government bond has dropped more than two percentage points from 5.5% to 3.3% indicating growth for the future looks subdued. The yield curve is now inverted and negative. The fact that cash rate is higher than longer term government bonds is extremely worrying and clearly signals that the Reserve Bank will continue to cut short term interest rates.

Meanwhile the Australian Dollar has already reached its peak against the US Dollar of US$1.10 but is still worth US$1.04, 18% higher than three years previously. Crude oil has risen 70% in three years and is worth US$112 a barrel. Iron ore, meanwhile, is US$100 a tonne, down around one third in four short months but still massively higher than the long run average.

The Australian sharemarket had risen 10% in four months, and as interest rates are lowered, is about to go on a tear and add about 24% in the next 12 months.

Fast forward again to the end of September 2015. Economic prospects for the country are much more subdued, the sharemarket is down around 13% from its 2015 peak — nearly all of this in the previous two savage months. The cash rate is sitting at 2%, as it has done for five previous months, and doesn’t look like going anywhere except down for the foreseeable future. There doesn’t appear to be much risk of recession, but not a lot of economic growth in the medium future either. The iron ore price has collapsed to US$57 a metric tonne, but remains volatile. The Australian Dollar is now buying US$0.70. The yield curve has had a huge parallel shift down. It’s flat for five years and then slightly positive from 10 to 15 years. The one and three year rates are lower than cash, indicating that expectations for economic growth are very low.

[via Financial Standard]

SMSF direct property investment

SMSF direct property investment jumps 60%

The value of self-managed super fund (SMSF) investment in residential real estate has jumped 60% in the last four years, according to figures from the Australian Securities and Investments Commission (ASIC).

In its submission to the Parliamentary Inquiry into Home Ownership, the primary financial markets regulator revealed that as of March 2015, the value of residential real property investments through SMSFs was $21.78 billion, or 3.7% of total Australian and overseas assets.

This is up from $19.49 billion, or 3.6% of total Australian and overseas assets, in March 2014.

Albeit from a relatively low base, there has been an increase in the value of investment in residential real property through SMSFs of 11.78% in the 12 months to March 2015, and an increase of 58.69% since March 2011.

While it is feared that SMSFs ability to borrow money to buy residential property via limited recourse borrowing arrangements (LRBAs) is helping to fuel the housing bubble, SMSF Association technical and professional standards director Graeme Colley said it is misleading to use these figures to conclude that SMSF investment in residential property is rapidly expanding.

“I’d be interested to see the whether there’s been much of an increase in the actual numbers of properties that have been bought. The rise in market value of residential property is likely to account for most of the increase,” Mr Colley said.

Colley also accused ASIC of stepping outside of its remit in drawing attention to the numbers.

“ASIC’s responsibility is to look at the provision of advice for SMSFs rather than these sorts of figures. I’m surprised to see them commenting”

The Financial System Inquiry (FSI) has recommended banning LRBAs, a move which was drawn criticism from industry quarters.

The Association of Financial Advisers dubbed a potential ban “draconian” at the SMSF Association Annual Conference back in February.

At the same conference, AMP SMSF head of policy Peter Burgess said: “So few funds use LRBAs, the effect is immaterial. Any problems should be addressed with legislation, and the effects measured before we scrap them off hand.”

[via Financial Standard]

Bond investors

Bond investors warned not to overlook

While most fixed income investors recognise the need to take a more flexible approach to finding return in a threatening interest rate environment, T. Rowe Price head of international fixed income Arif Husain believes that most investors are overlooking fixed income’s role in protecting portfolios from equity market shocks.

With record low interest rates and the 30-year bond market bull rally coming to a close, returns in fixed income markets are becoming increasingly hard to find. That is why many fund managers have successfully marketed so-called unconstrained bond funds which do away with traditional benchmarks and are instead free to use any market, any security, and any means to find value.

But while using currency markets, negative duration, derivatives and so forth to achieve higher returns is all very well, it only deals with one part of the fixed income story.

Speaking to Financial Standard, Husain said: “The unconstrained world is a garden of both good and evil. The majority of folk out there have taken that broader flexibility and used it to try and find return. To borrow an American expression, they go on offense.”

“We’re using all that extra flexibility to try and find new ways to go on defence.”

Husain wants his bond fund, the T. Rowe Price Dynamic Global Bond Fund, to behave like bond funds used to behave – to be a store of value, or even post positive returns when equity markets fall.

“We want to provide a bit more liquidity, a bit more simplicity and a bit more transparency. We don’t want to use all the funky derivative structures that are out there,” Husain added.

“I used to be a derivatives trader so I know there’s nothing wrong with them, but I don’t think every client wants them in their portfolio.”

What Husain and his team look for when buying bond markets is three characteristics: low volatility; little probability of what the bond expert calls ‘jump risk’, or a regime change in volatility; and a relatively steep yield curve.

Regionally that approach has seen the fund take a relatively negative view on the US, where Husain believes a rate hike will come sooner than most investors expect; a very positive view in Asia, especially in lower volatility countries like South Korea; and a negative view on Europe, where the outcome from Greece’s debt crisis remains uncertain.

The strategy is unique in that it was built for the Australian market. Unusually, it launched here first (in February 2014) and was then released to the US market later. It is only just being made available to European investors now.

The fund has not had its defensive characteristics fully tested yet as the equity market has performed well in the 18 months it has been running but Husain did note its rolling correlation with equities over that period has been close to zero, if not a little bit negative.

Further, in short, sharp periods where the equity market has faced drawdowns, the fund has done exactly what it’s aimed to do – either staying stable or posting positive returns.

“The coming months up until and a little bit after the Fed rate hike are going to be a real testing ground for these types of strategies. When we see negative returns across traditional bond funds, you’ll want to see these strategies at least at zero and hopefully positive,” Husain concluded.

[via Financial Standard]

Sydney Apartment

Beware over paying for assets

Sydney_Apartment1The Australian economy is facing a number of head wins as we enter 2015 and therefore is expected to grow below long term averages.  Whilst consumer spending is improving and residential construction and prices are rising, consumer confidence remains weak. Business confidence and investment is also weak.

Australian bond yields have fallen to historical lows. The RBA cut the cash rate by 25 basis points to 2.25% in February concluding that growth is continuing at a below trend pace, with domestic demand growth overall point weak.  The financial markets are expecting the RBA to make further cuts to interest rates in the coming months.

As a result, investors seeking yield will continue to reallocate from cash and term deposits into higher yielding assets, including real estate.  Demand for both residential and non-residential assets should continue and competition for both income generating and development assets will remain high.

According to the PCA/IPD Property Index, non-residential property has generated a total annual return of 10.6% in 2014, and Folkestone expects a similar return in 2015 as investor demand continues to underpin capital values.

Investors need to be cognisant that they do not overpay for assets in a market being driven by capital hunting for yield.  The market runs the risk that if the disconnect between capital market and real estate market fundamentals widens, the price some investors pay for assets may overshoot the underlying fundamentals.

In the residential sector, the housing boom has not been uniform across Australia.  Whilst Sydney has been the stand out performer with prices up 13% in the year to January 2015, price growth across the rest of Australia’s major cities was between -0.3% in Canberra and 7.0% in Melbourne.

There is no doubt the Sydney median house price has risen to levels that make it difficult for first home buyers to enter the market, but we should remember that the average annual growth in Sydney house prices has only risen by an average of 4.5% per annum over the past 10 years.  Sydney is now paying for a gross undersupply of accommodation as a result of poor government planning and high government levies which have restricted the release of land and pushed up land prices.

Low interest rates are certainly driving the investor market, with investors taking over owner occupiers as the largest borrowers of finance in the December quarter.  We expect investors will continue to invest in the residential sector in 2015 but in doing so, they need to ensure that they do their homework.  There are certain markets such as inner Melbourne and inner Brisbane where an oversupply is looming.

The recent APRA announcement around investment lending may go some way to restricting the availability of finance to investors.  Overall we are expecting another solid year of housing market conditions and further capital gains, albeit at a more sustainable rate than we have seen over 2014.

 — via the FINANCIAL STANDARD, Mar 30

SMSF growth driven by investor satisfaction

e5a04b4b0a0d02b701b0bf9ae24a6631The relative level of satisfaction with self managed super fund (SMSF) performance is a likely drive up for SMSF’s continued growth and significant market share, according to Roy Morgan Research.

Roy Morgan’s findings are based on a survey of 15,084 superannuation holders conducted in the half year to January 2015.

Satisfaction with super performance was measured across retail, industry and self managed funds. SMSF’s scored the highest with a satisfaction rating of 77.3%; industry and retail funds scored 59% and 56.3% respectively.

Overall satisfaction has increased by 4.5% to 58%.

Although the report notes that performance satisfaction generally increases with balance, SMSF’s steel have the highest satisfaction rating for all balances over $5000 in fact, at balances over $700,000, SMSF’s lead on industry and retail funds narrows to 3.2% and 6.3% respectively.

It is not difficult to see why SMSF’s have been so successful in achieving such rapid growth over the last decade or more,” said Roy Morgan Research industry Communications Dir Norman Morris.

“With satisfaction levels higher than Industry and Retail funds since 2002, they continue to pose a major threat to them, particularly for the higher balance members where a disproportionate level of superannuation balances are held.”

— Alex Burke via the FINANCIAL STANDARD

Economic growth to slow significantly

E071D108048541A4A4924248176C9FF9.ashxThe Intergenerational Report (IGR) has projected that the growth rate of the economy over the next 40 years will be significantly lower than the last 40.

In introducing the report Treasurer Joe Hockey said:

“it is fantastic that Australians are living longer and healthier lives but we need to address these demographic changes. If we don’t do something, we risk reducing our available workforce, impacting negatively on growth and prosperity, and our income will come under increasing pressure.”

Released today, the report projected average economic growth of 2.8% per annum over the next 40 years with annual growth per person of 1.5%. This would see the annual income of the average Australian rise from $66,400 today to $117,300 by 2055.

This growth rate is expected to be slower than the 3.15% per annum, or 1.7% per person, achieved over the past 40 years due to an ageing population and gradual decline in the participation rate.

“To achieve this level of growth going forward, we must take steps to build jobs and opportunity. We also need to make choices today to prepare for the future”, the report said.

We have a responsibility to plan and budget not only for today, but that tomorrow.  But we are currently living beyond our means.

The Australian government’s spending over $110 million per day more than it collects and his borrowing to meet the shortfall resulting in $40 million being spent per day on interest repayments.

However, the report said that if the government’s policies are fully implemented it projects the underlying ash balance to improve to a surplus of 1.4% of GDP in 2039 – 40, and then moderate to a surplus of around 0.5% of GDP in 2054 – 55. Net debt is projected to be fully paid off by around 2031 – 32.

The government is open to alternative measures to bring the budget back to surplus. The policies proposed by the government, if fully implemented, will improve Australia’s capacity to respond to the challenges and opportunities outlined in the Intergenerational Report.

Male life expectancy is projected to increase from 91.5 years today  to 95.1 years in 2055.  The number of Australians aged 65 and over is projected to more than double by 2055 compared with today.

The number of people aged between 15 and 64 for every person aged 65 and over has fallen from 7.3 people in 1975 to an estimated 4.5 people today. By 2055, this is projected to nearly halve again to 2.7 people.


 — Mark Smith via the FINANCIAL STANDARD